Step 3: Why my sysbench-trained build loses and how to do it right.
Given the topic complexity and the length of this article I have split it in 3 three different blog-post:
- What is PGO
- How PGO it works
- Why my sysbench-trained build loses and how to do it right.
Three compounding reasons:
- Uncovered code gets pessimized.
Sysbench-tpcc touches a narrow slice of mysqld.
Every function with zero counts is treated as cold: GCC optimizes it for size, skips inlining, and shoves it into cold sections.
But at runtime I still execute plenty of code my training never touched, such as purge, flushing, stats recalculation, error paths, different optimizer plans, connection churn.
All of that is now running de-optimized code, and I pay icache penalties every time hot code calls into "cold" regions.
This is why GCC added -fprofile-partial-training, without it, a narrow profile actively hurts everything outside it. - High-concurrency instrumented runs produce corrupted or skewed profiles.
GCC's profile counters are non-atomic by default.
With 128–1024 threads hammering the same counters I get lost updates and internally inconsistent counts (I actually had "profile count data file corrupted/inconsistent" warnings at the -fprofile-use compile).
I need to use -fprofile-update=atomic, which almost nobody sets and was at the beginning not aware of.
In short my profile was garbage and a garbage profile is worse than no profile, consistent with my PGO build being slower than plain -O3 at 128 threads. - Instrumentation distorts what "hot" means under contention.
The instrumented binary is 2–10x slower, which shifts where threads pile up. Spin loops in mutexes and rw-locks record enormous counts, so the compiler lavishes optimization on waiting code instead of useful work. While at high thread counts my real bottleneck is lock contention and memory latency things branch layout can't fix.
Do I have a way to merge the different profiles like MTR + sysbench?
The answer is yes. For GCC it's simple to do so, because the runtime automatically merges profile data across multiple training runs against the same instrumented binary. I don't need a separate merge step like Clang does.
What it does is that each time an instrumented binary exits, it writes its counters into files. If those files already exist (from a previous run), GCC's runtime adds the new counts to the existing ones rather than overwriting them.
So if I run MTR first, then run sysbench against the same instrumented build with the same FPROFILE_DIR, the second run's counts accumulate on top of the first. The final profile reflects both workloads combined.
Combining MTR with a moderate-thread sysbench run for PGO training is helpful because the two workloads cover different, complementary dimensions of mysqld's behavior:
- MTR sweeps broad functional breadth parser, optimizer, DDL, replication, error paths. However it runs almost entirely single-connection, so it never exercises the branches that only exist under real concurrency, like the contended slow-path of a latch, MVCC visibility checks against in-flight writers, lock-wait queuing, or redo-log group-commit batching;
- A moderate-concurrency sysbench run (something like 4–64 threads, enough to create actual simultaneous access without descending into the timing-distortion and counter-corruption problems), fills exactly that gap by giving those concurrency-only branches nonzero execution counts, which keeps the compiler from treating them as cold, since cold code paths get optimized for size instead of speed.
So the merged profile ends up with both the wide code coverage MTR provides and the concurrent-path coverage MTR structurally can't, at the cost of only a modest, second-order improvement over MTR alone since PGO's overall gains are already small and this specific slice of the binary is a narrow fraction of total execution.
However even where it does help, I am stacking a small effect on top of a small effect. I have already found PGO vs non-PGO gives me under 5%.
The incremental gain from better-covering a narrow slice of concurrency-only code within that is a second-order refinement.
It is plausibly in the sub-1% range, quite smaller than the run-to-run noise I had seen just from benchmark variance.
Or at least that is what I now think, let me validate it.
Commands to build the code:
cmake ../mysql-9.7.2 \
-DCMAKE_INSTALL_PREFIX=/opt/mysql_templates/mysql-9.7.2-PGO-instrument \
-DCMAKE_BUILD_TYPE=Release \
-DENABLED_LOCAL_INFILE=1 \
-DWITH_FEDERATED_STORAGE_ENGINE=1 \
-DWITH_ARCHIVE_STORAGE_ENGINE=1 \
-DWITH_PACKAGE_FLAGS=OFF \
-DCOMPILATION_COMMENT_SERVER="Marco compile 9.7.2-PGO instrument" \
-DCOMPILATION_COMMENT="Marco compile 9.7.2 PGO instrument" \
-DCMAKE_C_COMPILER=clang-20 \
-DCMAKE_CXX_COMPILER=clang++-20 \
-DCMAKE_C_FLAGS="-fuse-ld=lld" \
-DCMAKE_CXX_FLAGS="-fuse-ld=lld" \
-DFPROFILE_GENERATE=ON \
-DWITH_LTO=OFF \
-DFPROFILE_DIR=/opt/mysql_source/profile
Run the mtr:
perl mysql-test-run.pl --force --max-test-fail=0 --parallel=8 --suite=main,innodb,innodb_undo,binlog,rpl,perfschema,sys_vars
Then run the sysbench-tpcc test with 64 threads
sysbench /opt/tools/sysbench-tpcc/tpcc.lua --mysql-host=127.0.0.1 --mysql-port=3307 --mysql-user=app_test --mysql-password=test --mysql-db=tpcc --db-driver=mysql --tables=10 --scale=100 --rand-type=uniform --report-interval=1 --histogram --report_csv=yes --stats_format=csv --db-ps-mode=disable --trx_level=RR --enable_purge=yes --time=600 --threads=64 --mysql-ssl=PREFERRED --mysql-ignore-errors=none --reconnect=0 run
And got the profile as
[root@sm-blade03 profile]# llvm-profdata-20 show -detailed-summary /opt/mysql_source/profile/mysql.profdata
/opt/mysql_source/profile/mysql.profdata
Instrumentation level: IR entry_first = 0 instrument_loop_entries = 0
Total functions: 52403
Maximum function count: 289910820864
Maximum internal block count: 16881288068
Total number of blocks: 619050
Total count: 2473216025729
Detailed summary:
2 blocks (0.00%) with count >= 289910820864 account for 1% of the total counts.
2 blocks (0.00%) with count >= 289910820864 account for 10% of the total counts.
2 blocks (0.00%) with count >= 289910820864 account for 20% of the total counts.
11 blocks (0.00%) with count >= 16777125216 account for 30% of the total counts.
32 blocks (0.01%) with count >= 7806039615 account for 40% of the total counts.
77 blocks (0.01%) with count >= 3839409465 account for 50% of the total counts.
160 blocks (0.03%) with count >= 2273821592 account for 60% of the total counts.
312 blocks (0.05%) with count >= 1111890303 account for 70% of the total counts.
719 blocks (0.12%) with count >= 365989756 account for 80% of the total counts.
2165 blocks (0.35%) with count >= 85858392 account for 90% of the total counts.
4893 blocks (0.79%) with count >= 24359463 account for 95% of the total counts.
16760 blocks (2.71%) with count >= 2841200 account for 99% of the total counts.
45006 blocks (7.27%) with count >= 148881 account for 99.9% of the total counts.
96619 blocks (15.61%) with count >= 8640 account for 99.99% of the total counts.
157023 blocks (25.37%) with count >= 960 account for 99.999% of the total counts.
220001 blocks (35.54%) with count >= 91 account for 99.9999% of the total counts
Checking on how counts concentrate: just 2 blocks account for 20% of all executed instructions across the entire training run (almost certainly a tight InnoDB buffer-pool/redo-log/lock_manager loop counts in the hundreds of billions), while 90% of total execution volume is concentrated in only 2,165 blocks (0.35% of all covered blocks).
That's the "hot core" PGO is designed to find and optimize aggressively. Meanwhile the long tail, the other 96%+ of blocks, still has nonzero counts (this is a sparse profile, so anything appearing here was actually executed at least once).
Meaning a huge amount of MTR's functional-path breadth got captured even though it's numerically dwarfed by sysbench's tight hot loops.
This is the ideal shape for a merged profile: a small, extremely hot core (from sustained sysbench load) sitting on top of broad, low-frequency-but-nonzero coverage (from MTR's functional sweep).
If MTR had contributed nothing, I would have a much flatter, narrower distribution with far fewer total functions covered.
If sysbench had swamped everything with no MTR contribution, I would have a similar shape but with a much smaller "Total functions" number, since sysbench-tpcc only touches a fraction of mysqld's total surface.
Command to build the final optimized binaries:
llvm-profdata-20 merge -sparse /opt/mysql_source/profile/*.profraw -o /opt/mysql_source/profile/mysql.profdata

cmake ../mysql-9.7.2 \
 -DCMAKE_INSTALL_PREFIX=/opt/mysql_templates/mysql-9.7.2-PGO-optimized-MTR-sysbench \
  -DCMAKE_BUILD_TYPE=Release \
  -DENABLED_LOCAL_INFILE=1 \
  -DWITH_FEDERATED_STORAGE_ENGINE=1 \
  -DWITH_ARCHIVE_STORAGE_ENGINE=1 \
  -DWITH_PACKAGE_FLAGS=OFF \
  -DCOMPILATION_COMMENT_SERVER="Marco compile 9.7.2-PGO optimized MTR+sysbench" \
  -DCOMPILATION_COMMENT="Marco compile 9.7.2 PGO optimized MTR+sysbench" \
  -DCMAKE_C_COMPILER=clang-20 \
  -DCMAKE_CXX_COMPILER=clang++-20 \
  -DFPROFILE_USE=ON \
  -DFPROFILE_DIR=/opt/mysql_source/profile/mysql.profdata \
  -DWITH_SSL=system -DWITH_ZLIB=system -DWITH_LZ4=system -DWITH_ICU=system \
  -DWITH_NUMA=ON -DWITH_LTO=ON -DWITH_LD=lld -DWITH_SYSTEMD=1 \
  -DWITH_UNIT_TESTS=OFF -DWITH_ROUTER=OFF -DMYSQL_MAINTAINER_MODE=OFF
Re-running the test I got this:
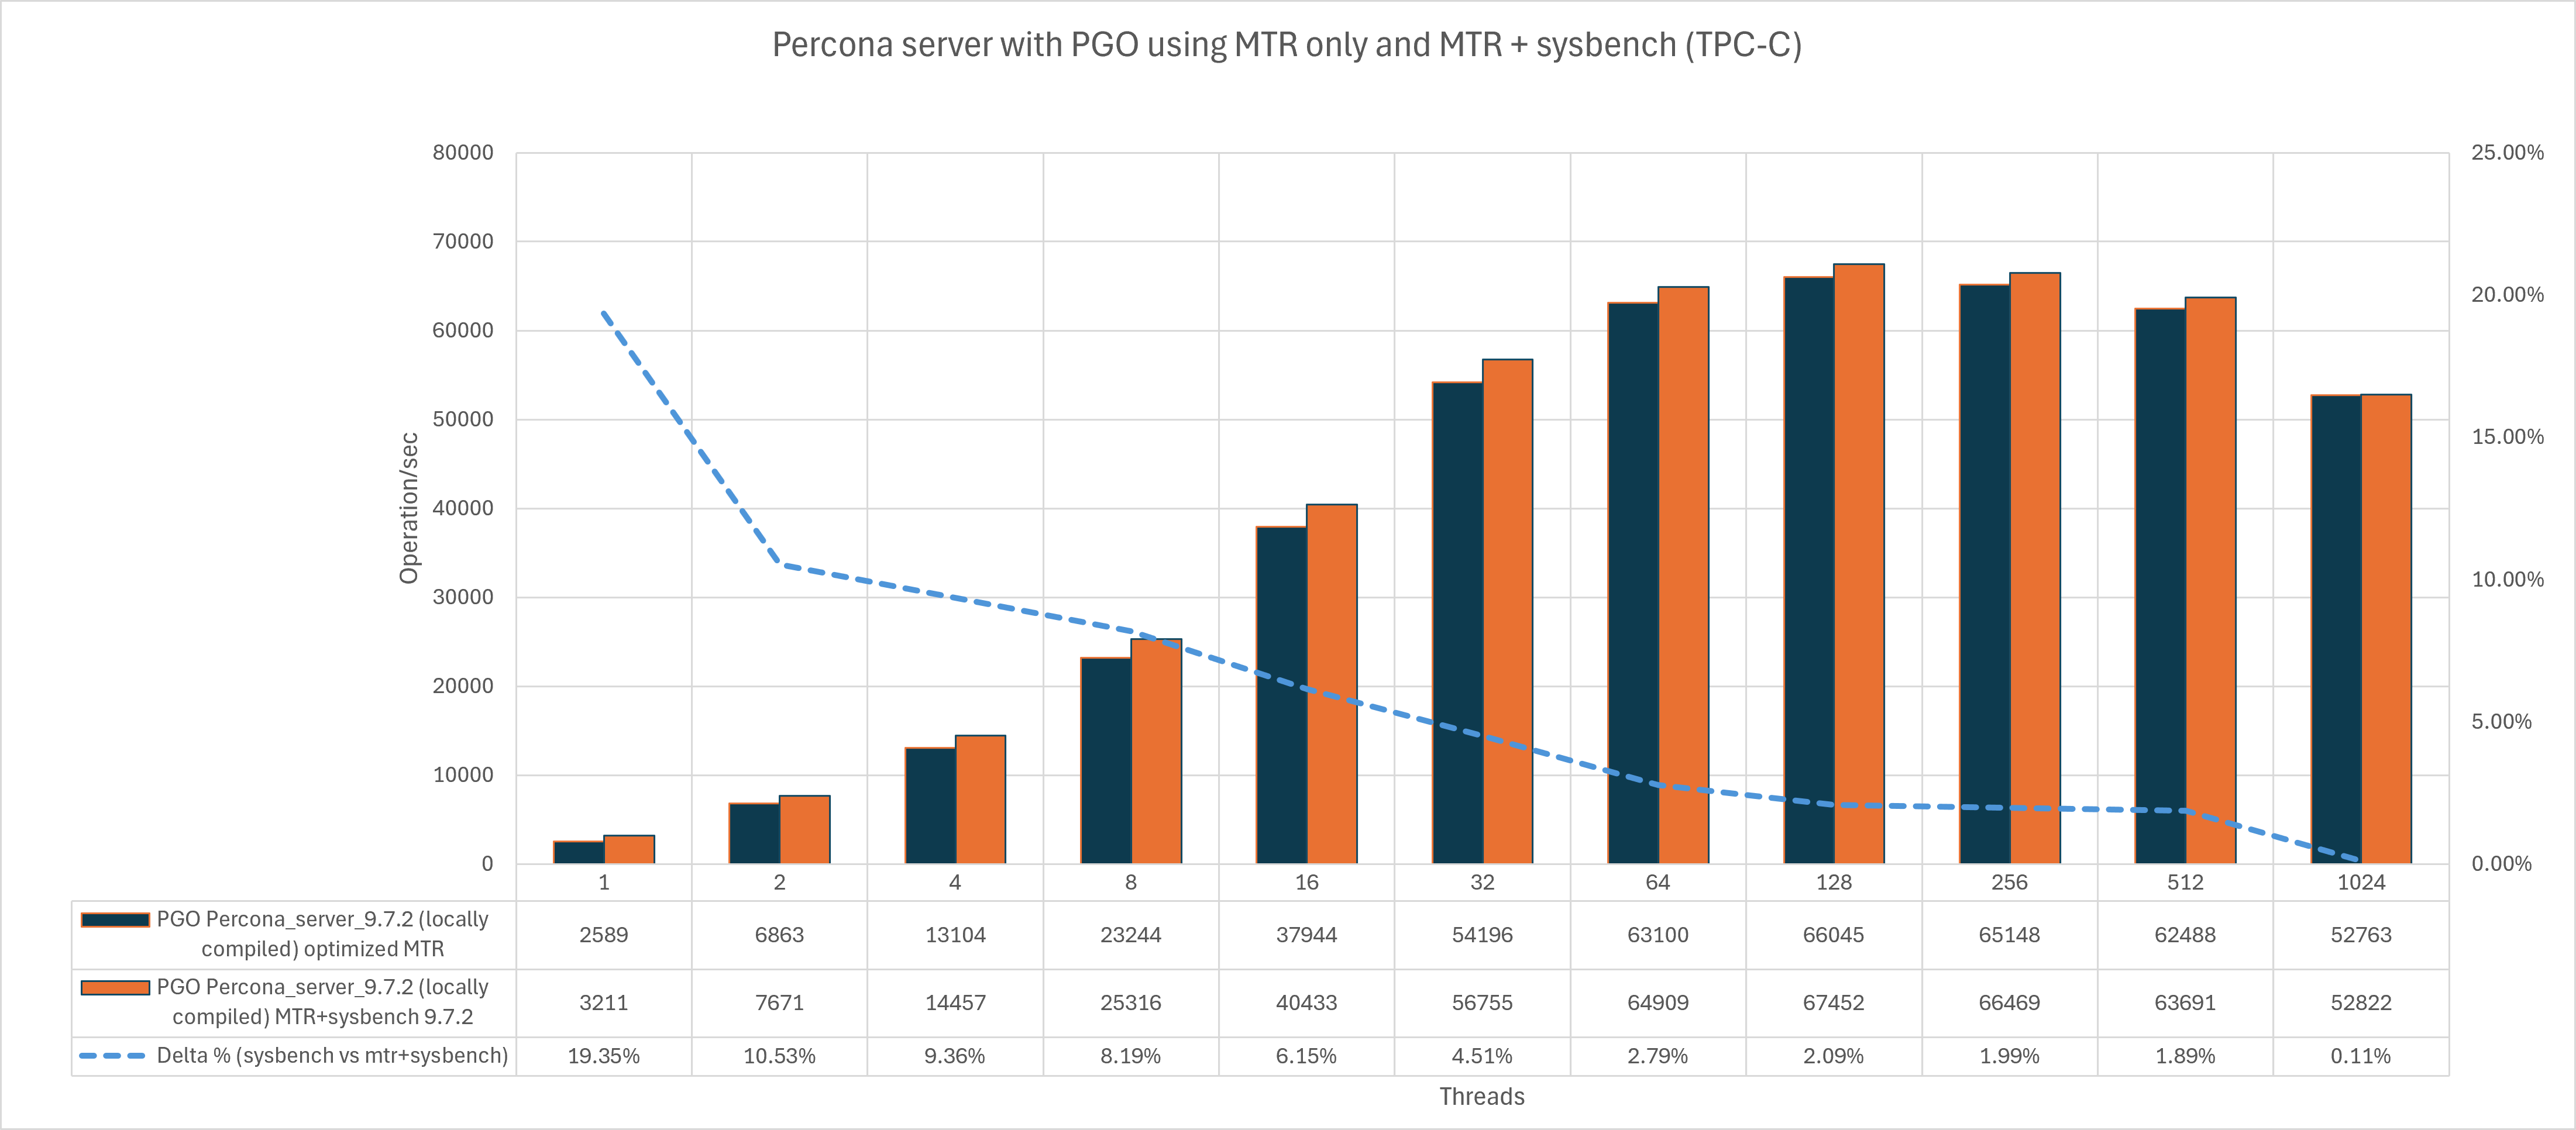
As expected the benefit I got was minimal, something was there but that disappeared while the concurrency increased.
Conclusions
- Non-PGO vs PGO comparison: we had a 12% increase with low concurrency. But when simulating a more realistic load with higher contention the win becomes smaller and smaller, under 2%.
- Training-workload choice mattered a lot: a sysbench-tpcc-trained PGO build ended up slower than a non-PGO.
- After switching to a merged MTR + moderate-concurrency-sysbench training profile and re-running, the gain was still minimal, and it shrank further as concurrency increased.
Why the sysbench-only build lost
Sysbench-tpcc only exercises a narrow slice of mysqld, so everything outside that slice (purge, flushing, stats, error paths, alternate optimizer plans) gets pessimized as "cold" code.
At 128–1024 threads, GCC's non-atomic profile counters get corrupted under contention unless I explicitly set -fprofile-update=atomic,a garbage profile is worse than no profile at all.
Instrumentation overhead (2–10x slowdown) distorts what looks "hot" under load mutex/rwlock spin loops dominate the counts, so the compiler optimizes waiting code instead of real work, while the actual bottleneck (lock contention, memory latency) is something branch layout can't fix anyway.
Bottom line: PGO for MySQL/Percona Server binaries does work in the sense that the mechanism is sound whole-binary function reordering for something the size of mysqld is a legitimate, often the single biggest, win in PGO generally.
But empirically here the payoff was consistently small (sub-5%, trending toward sub-1% for the concurrency-specific refinement), fragile to training-workload choice, fragile to build-flag correctness (atomic counters, -fprofile-partial-training), and it erodes further as thread count rises, which is exactly what happens in production and what we care about most.
So my practical answer: it's not a clear "yes, always compile with PGO." It's more a “maybe, and only if you get every detail right". Correct broad-coverage training data (MTR, ideally merged with moderate-concurrency sysbench), atomic profile counters, and realistic expectations that the win is marginal and shrinks under heavy concurrency.
Get any of those wrong and you can end up worse than a plain build.
Given the size of the benefit versus the number of ways to mess up the training methodology, PGO reads more like a niche optimization for a well-controlled build pipeline than a default you'd flip on broadly.
I would be more than happy to prove wrong and I am eager to get other people's feedback, so please test, test, test and let me know.
Happy MySQL to everyone
Go to: